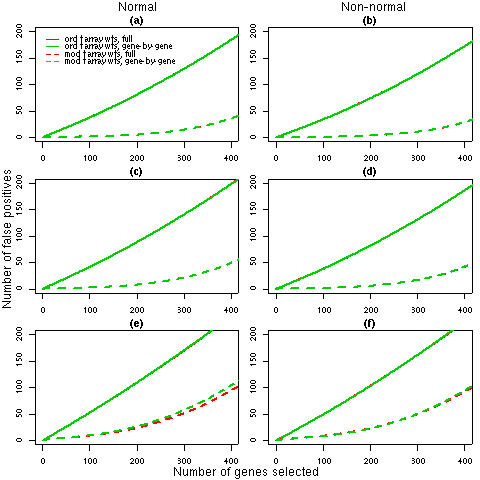
Figure 1: Number of false discoveries from simulated data sets with 3 arrays. For each 3 array simulation (1, 2 and 3 in Table 2), the average false discovery rates calculated using ordinary t-statistics (solid lines) or moderated t-statistics (dashed lines) are given. Panels (a), (c) and (e) show the results for normal data under simulations 1, 2 and 3 respectively while panels (b), (d) and (f) display the corresponding results for non-normal data. Each line is the average of 1000 simulated data sets. The false discovery rates for the full REML iterations (red) and the gene-by-gene update method (green), generally overlap, which indicates that any differences in the weights estimated by the two algorithms (refer to Table 2) have a negligible effect on the final results.
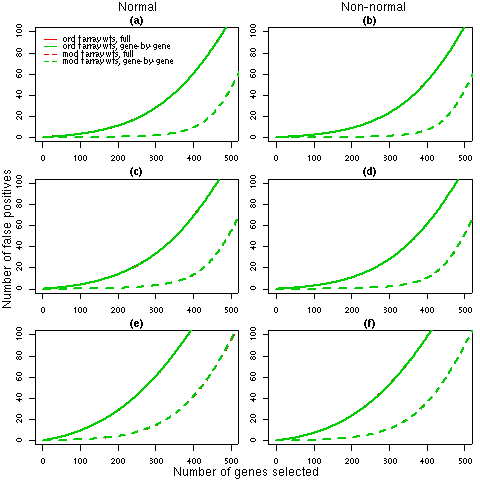
Figure 2: Number of false discoveries from simulated data sets with 5 arrays. For each 5 array simulation (4, 5 and 6 in Table 2), the average false discovery rates calculated using ordinary t-statistics (solid lines) or moderated t-statistics (dashed lines) are given. Panels (a), (c) and (e) show the results for normal data under simulations 4, 5 and 6 respectively while panels (b), (d) and (f) display the corresponding results for non-normal data. Each line is the average of 1000 simulated data sets. The false discovery rates for the full REML iterations (red) and the gene-by-gene update method (green) are identical, which indicates that any differences in the weights estimated by the two algorithms (refer to Table 2) have a negligible effect on the final results.