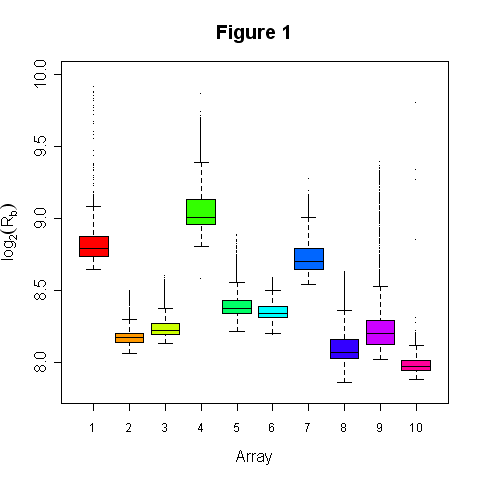
Figure 1: Red (Cy5) background intensities from arrays from the METH experiment. Arrays 1 and 4 have the highest levels of background.
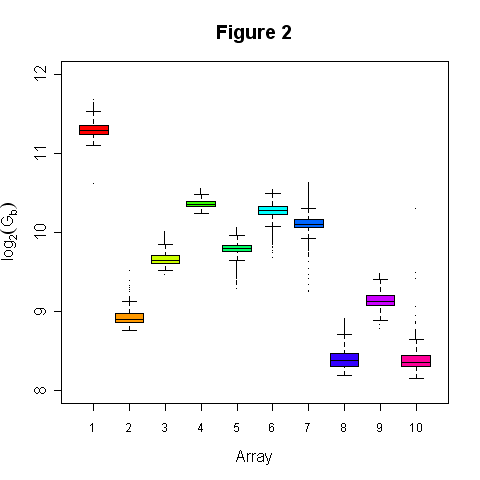
Figure 2: Green (Cy3) background intensities from the arrays from the METH experiment. Arrays 1 and 4 have the highest levels of background.