Summary plot based on gene set rank and size
BasalvsLP | BasalvsML
Open interactive plot
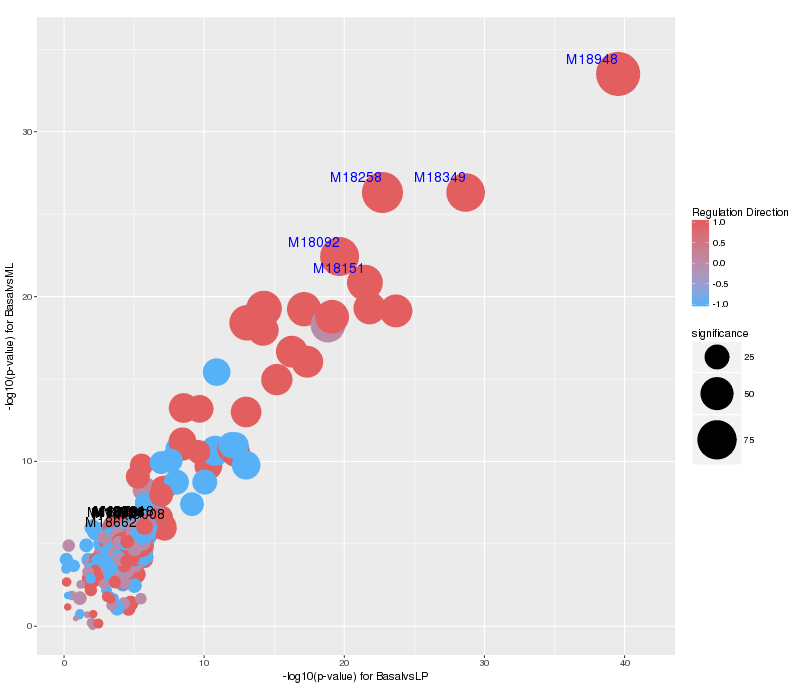
Summary plot based on regulation direction and significance
BasalvsLP | BasalvsML
Open interactive plot
Summary plot based on gene set rank and size
BasalvsLP | LPvsML
Open interactive plot
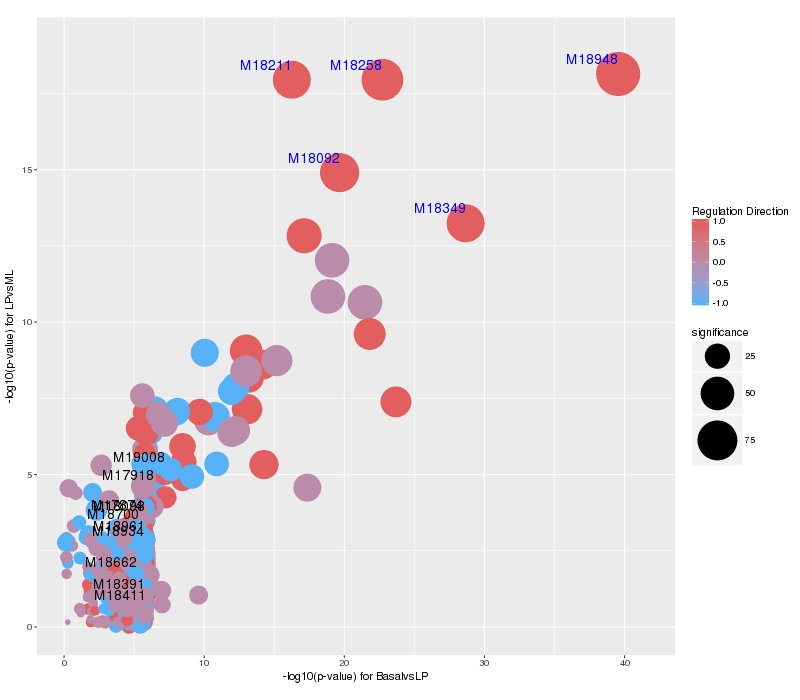
Summary plot based on regulation direction and significance
BasalvsLP | LPvsML
Open interactive plot
Summary plot based on gene set rank and size
BasalvsML | LPvsML
Open interactive plot
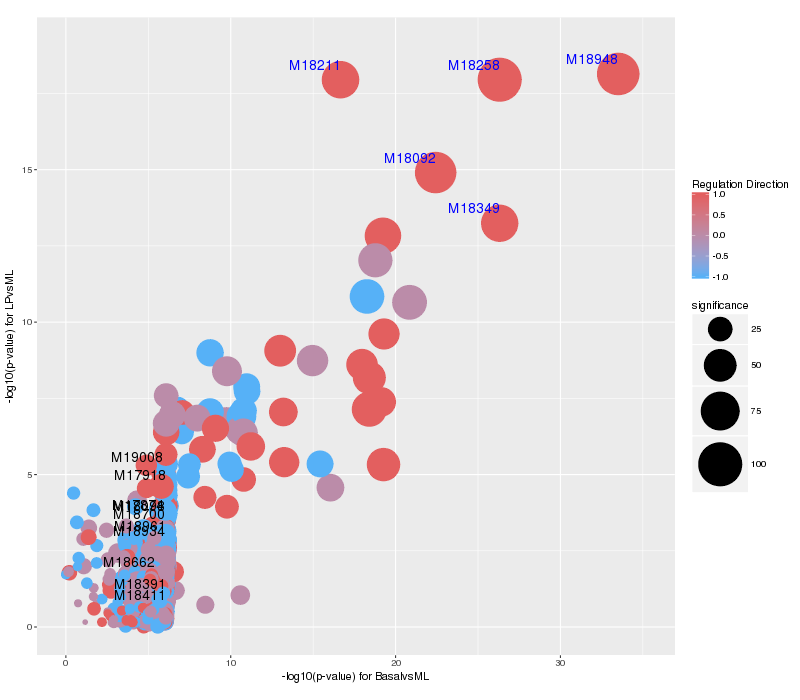
Summary plot based on regulation direction and significance
BasalvsML | LPvsML
Open interactive plot
Summary heatmap of the top gene sets (Interpret Results)
Open interactive plot
Bar plot of the top gene sets
Open interactive plot