HELP
The Situation
For this program to be useful for you, you will have a number of markers that
you believe have not had any recombination occurred between them. You want to
know if these markers are also linked to a quantitative trait loci.
The Data
For a number of individuals, you have the a phenotypic value and the
genotypic information. It will be assumed the phenotypic value is
continuous, and normally distributed.
Individuals where the phenotype could not be measured are also useful,
as they help estimate haplotype frequencies within the population. In
this case, missing values are to be labelled "." or "?" or "*".
The Program
Using the EM algorithm, the program estimates the frequencies of the haplotypes
found within the population. This gives, for each individual, a list of
possible pairs of haplotypes, and there associated probabilities.
The output of the program, contains estimates for the expected value of the
quantitative trait, given all possible pairs of haplotypes.
A hypothesis test is available, to ascertain whether the QTL is within the vicinity of the markers.
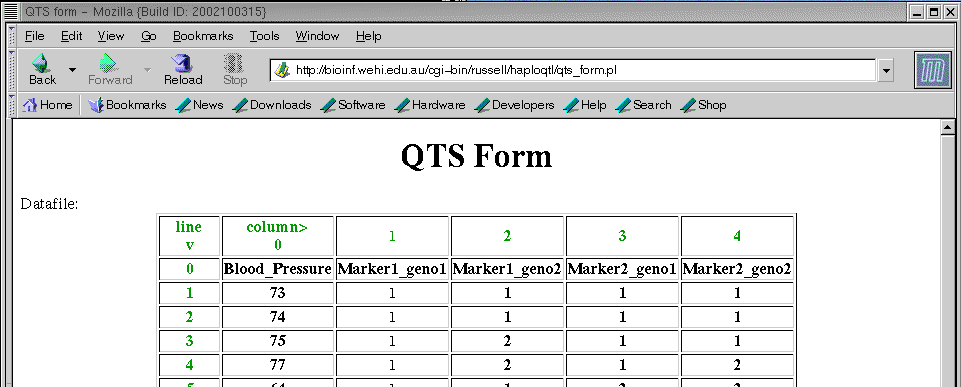
An example
Blood_Pressure Marker1_geno1 Marker1_geno2 Marker2_geno1 Marker2_geno2
73 1 1 1 1
74 1 1 1 1
75 1 2 1 1
77 1 2 1 2
64 1 1 2 2
74 1 2 1 2
67 2 2 1 1
68 2 2 1 1
70 2 2 1 2
68 2 2 2 2
64 2 2 2 2
? 2 2 2 2
In this example, there are 12 patients which have been genotyped at two
linked markers, thought to be linked to a qtl responsible for differences
in blood pressure. This data can be cut and paste into the box on the
previous page.
Note: You can copy and paste your data in from most other programs,
including EXCEL.
In the box labelled, "Enter number of markers:" on the previous page,
the number "2" should be given, as in this example we have 2 markers.
The option,
"Columns are separated by a tab, space, comma or any whitespace."
can be left as whitespace (either tabs or spaces), since the
columns in the data set are separated by spaces.
If you now click on the button marker run, you should get the page:
If you scroll down the page...
you will see the question "Enter the number of alleles at..."
This will need a "2" in both boxes, since there are 2 alleles
(labelled 1 and 2) for both markers.
The smallest allele is 1 at both markers.
The program will assume that the allele labels are in ascending order,
starting with the smallest allele. If there are gaps, the program
should still work (although it may take a bit longer to realise the
frequency of the missing alleles is zero).
The default values of this form are correct for the example data set
and you won't need actually need to change anything,
unless you wont to carry out a hypothesis test.
Interpreting the Results
The model.
The program has first used an EM algorithm, to estimate the frequencies of
each of the haplotypes.
The program then used an EM algorithm to estimate the influence of a haplotype
on the phenotype. It is assumed that the influence of each
haplotype is additive. This means that the expected phenotype of an individual
given its haplotypes is the sum of the influence from the two haplotypes.
The expected phenotypic value is then modelled with a normal mixture model
with parameters µhap, for all possible haplotypes, and
σ².
The µhap1 is the influence of having hap1,
on an individual's phenotype, where an individual with haplotypes, hap1
and hap2 has an expected phenotypic value of µhap1
+ µhap2.
σ² is the variance of this influence.
The example
If you entered the example data set,
then the results page would contain the following table of estimated
parameters.
| Haplotype |
Frequency |
µhap |
| 1-1 | 0.273 | 38.373 |
|---|
| 1-2 | 0.102 | 32.001 |
|---|
| 2-1 | 0.268 | 34.214 |
|---|
| 2-2 | 0.357 | 34.484 |
|---|
In this example, an individual with haplotypes 1-1 and 1-2
has an expected phenotypic value of
E(phenotype | 1-1 , 1-2) = 38.373 + 32.001 = 70.374 .
Similarly, the expected phenotype can be found
for an individual with any of the 16 possible pairs of haplotypes here.
The hypothesis test is designed to see if the phenotype is
influenced by the genetic information at the linked markers.
If the phenotype is independent of the haplotypes an individual
has at the linked markers (H0), then the
µhap's will be the same for all haplotypes,
In fact they will be equal to half the mean phenotypic
value for all individuals.
In the example, E(phenotype) = 70.364 and the
µhap's will actually be 35.182. The hypothesis
test will test whether the estimates the µhap's
are significantly different from this.
How the p-value is calculated
The test is carried out using a permutation method. The result is
given by a p-value where you accept H1 at the 5% level
when the p-value is less than 0.05.
The permutation test will permute the phenotypic values with respect to
the genotype information. Each permutation represents an example data set
under the null hypothesis. The log likelihood is calculated for each
permutation and the p-value is given by the proportion of permutations where
the log likelihood value is greater than that of the original data set.
There is an option to give a graph of the distribution function of the
log likelihood under H0.
This gives a histogram of the log likelihood values for all the permutations.
The "^" marks where the log likelihood value for the original data set falls.
Linkage Disequilibrium
If the data set contains two markers, each with two alleles, then Lewontin's D'
will be calculated. This is given by
D' = D / Dmax
where D = p(1-1) × p(2-2) - p(1-2) × p(2-1)
Dmax = min( p1(1-p2) , (1-p1)p2 ) when D > 0
Dmax = min( p1p2 , (1-p1)(1-p2) ) when D < 0
p(1-1) is the frequency of haplotype 1-1 (and similarly for 1-2 , 2-1 , 2-2 )
p1 is the frequency of allele 1 at marker 1
p2 is the frequency of allele 1 at marker 2
Russell Thomson
Last modified: